Basic Education and Special Ed had the largest per-unit spending increases
Finding
Per enrollment unit, the largest increases came from Basic Education (+$977.79), Special Ed state funding (+$809.37) and districtwide support (+$397.47). The largest decreases came from ESSER III (-$314.27), ESSER II (-$251.63) and SLFRF enrollment stabilization (-$188.36). These selected program bars do not need to sum to the statewide change.
- Program
- An OSPI F-196 program code and its title, used to group expenditures within the General Fund.
Does every district report every year? No. Of 326 listed reporting entities, 318 reported General Fund expenditures in 2021-22 and 319 in 2024-25; 319 and 326 carried an enrollment value in those years.
Material qualifications
- The selected relief programs are an explicit choice of six OSPI codes, including program 23, and differ from OSPI's own five-code CARES grouping.
- The denominator is OSPI financial-summary enrollment, which mixes full-time-equivalent K-12 enrollment with birth-to-five special-education headcounts and various institutional programs, so it is not a count of individual K-12 students.
- Nothing here establishes the causes of these changes, or speaks to adequacy, efficiency, educational quality or district reserve levels.
Exact quantities
Scroll horizontally to see all columns.
| Quantity | Value | Unit | Denominator | Uncertainty |
|---|---|---|---|---|
| Change per enrollment unit, Basic Education | 977.79 | dollars per enrollment unit | OSPI financial-summary enrollment in each year. | An exact difference of two reported ratios. |
| Change per enrollment unit, state Special Education | 809.37 | dollars per enrollment unit | OSPI financial-summary enrollment in each year. | An exact difference of two reported ratios. |
| Change per enrollment unit, Districtwide support | 397.47 | dollars per enrollment unit | OSPI financial-summary enrollment in each year. | An exact difference of two reported ratios. |
| Change per enrollment unit, ESSER III | -314.27 | dollars per enrollment unit | OSPI financial-summary enrollment in each year. | An exact difference of two reported ratios. |
| Change per enrollment unit, ESSER II | -251.63 | dollars per enrollment unit | OSPI financial-summary enrollment in each year. | An exact difference of two reported ratios. |
| Change per enrollment unit, SLFRF enrollment stabilization | -188.36 | dollars per enrollment unit | OSPI financial-summary enrollment in each year. | An exact difference of two reported ratios. |
Principal figure
Which programs drove the change in spending per enrollment unit?
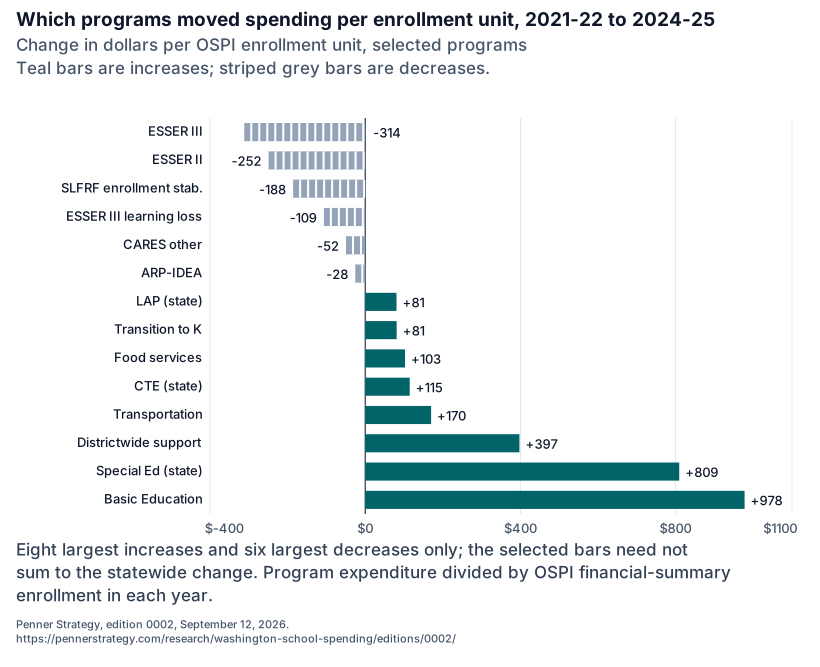
The chart shows the eight largest per-unit increases, led by Basic Education and Special Ed, and the six largest decreases, led by ESSER III and ESSER II; selected bars need not sum to the statewide change.
The selected relief programs are an explicit choice of six OSPI codes, including program 23, and differ from OSPI's own five-code CARES grouping.
The denominator is OSPI financial-summary enrollment, which mixes full-time-equivalent K-12 enrollment with birth-to-five special-education headcounts and various institutional programs, so it is not a count of individual K-12 students.
View data table
Scroll horizontally to see all columns.
| Program | Change per enrollment unit (dollars per enrollment unit) | Change per enrollment unit as recorded (dollars per enrollment unit) |
|---|---|---|
| ESSER III | -314.27 | -314.26704545482824 |
| ESSER II | -251.63 | -251.63173017129208 |
| SLFRF enrollment stab. | -188.36 | -188.3585361198666 |
| ESSER III learning loss | -109.09 | -109.08633805644703 |
| CARES other | -52.10 | -52.10453216949538 |
| ARP-IDEA | -28.10 | -28.09748689499685 |
| LAP (state) | 80.67 | 80.66957929613261 |
| Transition to K | 81.05 | 81.0479015535588 |
| Food services | 102.69 | 102.68809116041824 |
| CTE (state) | 114.72 | 114.72356446170204 |
| Transportation | 169.87 | 169.86687313587674 |
| Districtwide support | 397.47 | 397.4652542721255 |
| Special Ed (state) | 809.37 | 809.3689966392085 |
| Basic Education | 977.79 | 977.7944385197296 |
Sources and calculations:
How the evidence supports this finding
Each program's contribution is its own spending per enrollment unit in the later year minus the same ratio in the earlier year.
Evidence that could change the finding
A revision by OSPI to either year's program-level totals.
Sources and calculations
Scroll horizontally to see all columns.
| Evidence | Locator | Source | Publisher |
|---|---|---|---|
| Plotted program changes per enrollment unit | data selection: Sheet 'EXP by Program'; fields program and pp_change_dollars; the 14 rows with the eight largest increases and six largest decreases; all other program rows excluded. | Ten-year F-196 financial summary workbook, 2024-25 | Washington Office of Superintendent of Public Instruction |
| Program titles for the selected codes | record: Programs sheet, codes 11, 12, 13, 14, 19 and 23 | F-196 accounting manual program codes, 2024-25 | Washington Office of Superintendent of Public Instruction |
All fourteen plotted program changes were recomputed from the captured workbook and matched the plotted rows exactly.
Data, code and downloads
Every file this finding rests on. Figures carry their own download links beside them.
- Plotted program contributions
Exactly the fourteen program rows drawn in the program-contribution figure, in plotted order.
- Statewide program expenditure
Statewide expenditure in both years for each plotted program, read from the captured workbook.
Later changes
Updates to this finding. Corrections and withdrawals are listed with the current answer.
Use this research
Penner Strategy. "Basic Education and Special Ed had the largest per-unit spending increases". Washington school spending rose 12.5 percent per enrollment unit, or 0.8 percent after U.S. consumer-price inflation. Version 0002. September 12, 2026. https://pennerstrategy.com/research/washington-school-spending/editions/0002/findings/f-program-mix/. Qualification: The selected relief programs are an explicit choice of six OSPI codes, including program 23, and differ from OSPI's own five-code CARES grouping.
- Print this edition
- Machine-readable release (JSON)
- Supporting files are available from the original source. See the evidence records for each source link.