Washington school spending, 2021-22 to 2024-25: inflation, relief funds and longer comparisons
Endpoint comparisons: school years 2018-19, 2019-20 and 2021-22, each compared with 2024-25. Intervening school years are not all measured.
Washington's public schools spent more per enrollment unit in 2024-25 than in three earlier comparison years. Adjusted for consumer prices, most of the increase across these years shrinks or disappears.
Washington's Office of Superintendent of Public Instruction (OSPI), the state education agency, tracks statewide spending per enrollment unit from the General Fund, the main fund for school operations for public school districts. Comparing 2024-25 to three different starting years, 2018-19, 2019-20, and 2021-22, nominal spending per enrollment unit rose 36.0%, 32.1%, and 12.5%. After adjusting for national consumer prices, those increases fall to 8.3%, 6.7%, and 0.8%. After Seattle-area consumer prices, the 2021-22 comparison turns negative, a 1.5% decline. The enrollment measure combines course-load-based counts with headcounts from some other programs. It is not a count of individual students.
Explanation updated September 12, 2026. The dates above describe the records studied.
enrollment unit
OSPI's measure combining enrollment measured by course load with other headcounts, including young children in special education and state institutions.
CPI-U
Consumer Price Index for All Urban Consumers, a measure of general household prices, not school-specific costs.
nominal
A dollar figure not adjusted for inflation.
Principal limit The denominator is OSPI financial-summary enrollment, which mixes full-time-equivalent K-12 enrollment with birth-to-five special-education headcounts and various institutional programs, so it is not a count of individual K-12 students.
Answer
Washington school districts and tribal compact schools report General Fund spending to OSPI's F-196 financial summary. Between the 2021-22 and 2024-25 school years that spending rose 12.5% per enrollment unit, from $17,213.81 to $19,371.31, and the earlier year included $1,015,767,886.56 of selected federal COVID relief spending against $3,491,983.06 in the later year. After adjusting for U.S. consumer prices the increase was 0.8%; after Seattle-area consumer prices it was a 1.5% decrease. The denominator, OSPI's financial-summary enrollment, mixes full-time-equivalent K-12 enrollment with birth-to-five special-education headcounts and institutional programs, so it is not a simple student count. Of the 326 reporting entities the workbook lists, 318 report General Fund spending in 2021-22 and 319 in 2024-25, and 319 and 326 carry an enrollment value in those years.
Material qualifications
The denominator is OSPI financial-summary enrollment, which mixes full-time-equivalent K-12 enrollment with birth-to-five special-education headcounts and various institutional programs, so it is not a count of individual K-12 students.
CPI-U measures general consumer prices, not the prices schools themselves pay for staff, materials or services, and no school input-cost index is used here.
Each comparison uses only its two endpoint school years; the years between them, including 2020-21, are not examined, even though the workbook holds other years.
Nothing here establishes the causes of these changes, or speaks to adequacy, efficiency, educational quality or district reserve levels.
Current answer from edition 0002 · Dated September 12, 2026 ·This dated edition
Evidence covers sources through September 11, 2026.
How much did spending per enrollment unit change between 2021-22 and 2024-25?
Washington General Fund expenditures per enrollment unit rose from $17,213.81 in 2021-22 to $19,371.31 in 2024-25, a nominal increase of 12.5%. Statewide General Fund expenditures were $18,468,601,374.12 in 2021-22 and $21,081,063,857.94 in 2024-25. This figure is not adjusted for inflation.
General Fund spending per enrollment unit rose 12.5% in nominal dollars
Washington's statewide General Fund expenditures went from $18,468,601,374.12 in 2021-22 to $21,081,063,857.94 in 2024-25. Divided by OSPI's financial-summary enrollment measure, that is $17,213.81 per enrollment unit in 2021-22 and $19,371.31 in 2024-25, a nominal increase of 12.5%. This figure is not adjusted for inflation and includes federal relief spending.
Is this really 'per student'? No. It is spending divided by OSPI's financial-summary enrollment, which is not a count of individual K-12 students.
The denominator is OSPI financial-summary enrollment, which mixes full-time-equivalent K-12 enrollment with birth-to-five special-education headcounts and various institutional programs, so it is not a count of individual K-12 students.
How does the change differ across nominal and inflation-adjusted measures?
Figure 1. The nominal change, the change excluding the selected relief programs, each of those after each of the two consumer price indexes.Download chart (PNG)
Six percentage changes from 2021-22 to 2024-25: 12.5% nominal, 19.1% excluding relief, 0.8% after U.S. inflation, -1.5% after Seattle-area inflation, 6.6% and 4.2% excluding relief and adjusted for each inflation series.
The denominator is OSPI financial-summary enrollment, which mixes full-time-equivalent K-12 enrollment with birth-to-five special-education headcounts and various institutional programs, so it is not a count of individual K-12 students.
CPI-U measures general consumer prices, not the prices schools themselves pay for staff, materials or services, and no school input-cost index is used here.
View data table
Scroll horizontally to see all columns.
Figure 1 data. How does the change differ across nominal and inflation-adjusted measures? Each quantity appears rounded to two decimals and again exactly as recorded. Exact plotted rows: assets/data/statewide-change.csv
Whether this nominal figure reflects inflation or the presence of federal relief spending concentrated in 2021-22 is addressed separately.
How much of that change is inflation?
Adjusted for U.S. consumer prices, the increase in spending per enrollment unit is 0.8%. Adjusted for Seattle-Tacoma-Bellevue area consumer prices, it is a 1.5% decrease. Both use the mean of each school year's monthly CPI-U readings.
Inflation shrinks or reverses the spending increase
Using the U.S. CPI-U (mean index 285.848 in 2021-22, 319.205 in 2024-25), the increase in spending per enrollment unit falls to 0.8%. Using the Seattle-Tacoma-Bellevue area CPI-U (mean 314.668 in 2021-22, 359.602 in 2024-25), spending per enrollment unit fell 1.5%.
What does 'adjusted for inflation' mean here? Spending per enrollment unit is divided by the mean of that school year's monthly consumer price index readings, using either the U.S. or the Seattle-area CPI-U series.
Why are there two inflation-adjusted figures? One uses the U.S. city-average CPI-U (12 monthly readings per year); the other uses the Seattle-Tacoma-Bellevue area CPI-U (published every second month, 6 readings per year). They give 0.8% and -1.5% respectively.
CPI-U measures general consumer prices, not the prices schools themselves pay for staff, materials or services, and no school input-cost index is used here.
Whether school-specific input costs moved differently from general consumer prices over this period is not addressed.
Spending excluding federal COVID relief
Selected federal relief programs spent $1,015,767,886.56 in 2021-22 and $3,491,983.06 in 2024-25. Excluding this spending, the nominal change is 19.1%, 6.6% after U.S. inflation and 4.2% after Seattle-area inflation. No relief-excluded measure exists for the 2018-19 or 2019-20 windows.
Excluding the six selected federal relief programs, the change is 19.1% in dollars reported
Selected federal relief program spending was $1,015,767,886.56 in 2021-22 and $3,491,983.06 in 2024-25. Excluding it, the nominal change is 19.1%, the change after U.S. inflation is 6.6%, and the change after Seattle-area inflation is 4.2%. No relief-excluded measure exists for the 2018-19 or 2019-20 windows because those columns carry no relief-program values.
What counts as 'federal COVID relief spending' here? Six OSPI program codes: SLFRF enrollment stabilization, ESSER II, ESSER III, ESSER III learning loss, other CARES Act spending, and ARP-IDEA special education.
The selected relief programs are an explicit choice of six OSPI codes, including program 23, and differ from OSPI's own five-code CARES grouping.
Whether a different selection of relief program codes would produce a different result is not tested.
Does the answer change if the comparison starts from a different year?
Starting from 2018-19, the nominal change to 2024-25 is 36.0%, 8.3% after U.S. inflation and 4.5% after Seattle-area inflation. Starting from 2019-20, it is 32.1%, 6.7% and 3.3%. Starting from 2021-22, it is 12.5%, 0.8% and -1.5%. None of these three starting years is privileged over the others.
Starting years change the comparison
Starting from 2018-19, the nominal change to 2024-25 is 36.0%, or 8.3% after U.S. inflation and 4.5% after Seattle-area inflation. Starting from 2019-20, it is 32.1% nominal, 6.7% and 3.3%. Starting from 2021-22, it is 12.5% nominal, 0.8% and -1.5%.
Why do the same figures produce three different percentages? Because the size of the measured change depends on which school year the comparison starts from; this article compares three starting years, all ending in 2024-25, without examining the years in between.
None of the three starting years used for comparison, 2018-19, 2019-20 or 2021-22, is privileged over the others, and the school years between them are not compared.
Does the size of the change depend on the year you start counting from?
Figure 2. The nominal change and the change after each of the two consumer price indexes, measured from 2018-19, from 2019-20 and from 2021-22, every window ending 2024-25.Download chart (PNG)
Starting from 2018-19 gives 36.0% nominal (8.3% after U.S. inflation); from 2019-20, 32.1% (6.7%); from 2021-22, 12.5% (0.8%). All three windows end in 2024-25.
None of the three starting years used for comparison, 2018-19, 2019-20 or 2021-22, is privileged over the others, and the school years between them are not compared.
CPI-U measures general consumer prices, not the prices schools themselves pay for staff, materials or services, and no school input-cost index is used here.
View data table
Scroll horizontally to see all columns.
Figure 2 data. Does the size of the change depend on the year you start counting from? Each quantity appears rounded to two decimals and again exactly as recorded. Exact plotted rows: assets/data/base-year-windows.csv
The school years between each pair of endpoints, including 2020-21, are not examined.
Enrollment units used in the calculation
The denominator is OSPI's financial-summary enrollment, which mixes full-time-equivalent enrollment for regular K-12 and other programs with birth-to-five special-education headcounts. It also includes skill-center summer programs, detention centers and other state institutions. It is not a count of individual K-12 students.
Enrollment units differ from student headcounts
OSPI's financial-summary enrollment mixes full-time-equivalent enrollment for regular K-12 and other programs with birth-to-five special-education headcounts, and it includes skill-center summer programs, detention centers and other state institutions. All per-unit figures in this article divide by this measure.
What is an 'enrollment unit'? The denominator from OSPI's ten-year financial summary workbook: it mixes FTE K-12 enrollment with birth-to-five special-education headcounts and various institutional programs.
The denominator is OSPI financial-summary enrollment, which mixes full-time-equivalent K-12 enrollment with birth-to-five special-education headcounts and various institutional programs, so it is not a count of individual K-12 students.
Which programs account for the largest per-unit dollar shifts?
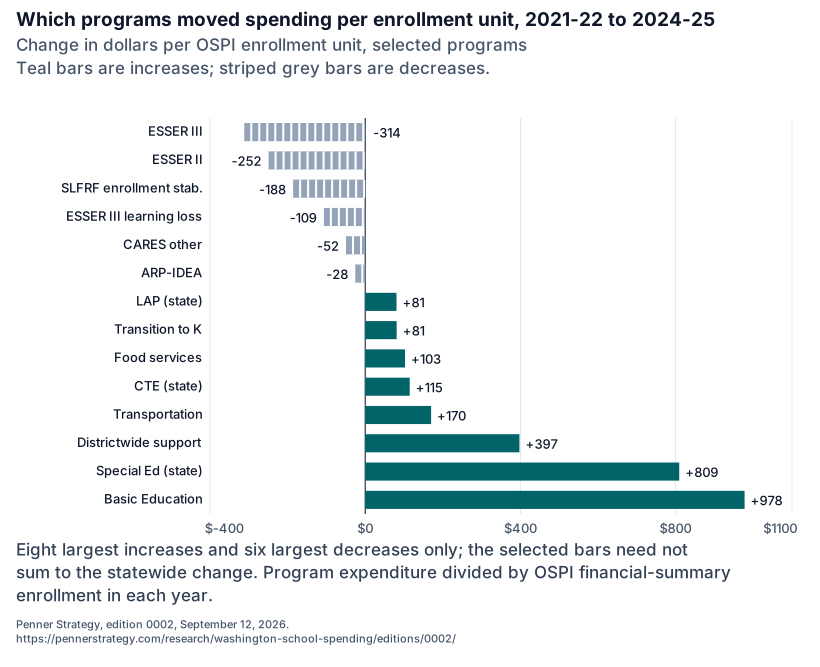
The largest per-unit increases came from Basic Education (+$977.79), Special Ed state funding (+$809.37) and districtwide support (+$397.47). The largest per-unit decreases came from ESSER III (-$314.27), ESSER II (-$251.63) and SLFRF enrollment stabilization (-$188.36).
Basic Education and Special Ed had the largest per-unit spending increases
Per enrollment unit, the largest increases came from Basic Education (+$977.79), Special Ed state funding (+$809.37) and districtwide support (+$397.47). The largest decreases came from ESSER III (-$314.27), ESSER II (-$251.63) and SLFRF enrollment stabilization (-$188.36). These selected program bars do not need to sum to the statewide change.
Does every district report every year? No. Of 326 listed reporting entities, 318 reported General Fund expenditures in 2021-22 and 319 in 2024-25; 319 and 326 carried an enrollment value in those years.
The selected relief programs are an explicit choice of six OSPI codes, including program 23, and differ from OSPI's own five-code CARES grouping.
Which programs drove the change in spending per enrollment unit?
Figure 3. Change in dollars per enrollment unit for the eight largest increases and six largest decreases by program.Download chart (PNG)
The chart shows the eight largest per-unit increases, led by Basic Education and Special Ed, and the six largest decreases, led by ESSER III and ESSER II; selected bars need not sum to the statewide change.
The selected relief programs are an explicit choice of six OSPI codes, including program 23, and differ from OSPI's own five-code CARES grouping.
The denominator is OSPI financial-summary enrollment, which mixes full-time-equivalent K-12 enrollment with birth-to-five special-education headcounts and various institutional programs, so it is not a count of individual K-12 students.
View data table
Scroll horizontally to see all columns.
Figure 3 data. Which programs drove the change in spending per enrollment unit? Each quantity appears rounded to two decimals and again exactly as recorded. Exact plotted rows: assets/data/program-contributions.csv
Program
Change per enrollment unit (dollars per enrollment unit)
Change per enrollment unit as recorded (dollars per enrollment unit)
The selected bars do not need to sum to the statewide change, so this does not fully account for the total change.
Study scope
Population
The 326 reporting entities listed in OSPI's ten-year F-196 financial summary, covering Washington school districts and tribal compact schools. The number that reports a value differs by school year, so the roster is 326 and the reporting count is not: 313 entities report General Fund expenditures in 2018-19, 311 in 2019-20, 318 in 2021-22 and 319 in 2024-25, and 323, 319, 319 and 326 rows carry an enrollment value in those years. Each statewide total is the sum of the rows that carry a value in that year, which equals OSPI's own total row to the cent.
Place
Washington (ANSI state FIPS 53, boundary OSPI 2024-25 reporting entities)
Period
School years 2018-19, 2019-20, 2021-22 and 2024-25: September 1, 2018 to August 31, 2025 (academic)
Units
dollars, enrollment units, dollars per enrollment unit, percent, index points
Excludes
Capital projects, debt service and other funds outside the General Fund. Other school years in the workbook, before this edition's period: 2014-15 through 2017-18. School years inside the period that this edition does not read: 2020-21, 2022-23 and 2023-24. The school years inside each comparison, which is measured between its two endpoints only. District-level results, which this edition does not publish.
Definitions
General Fund expenditures
What Washington reporting entities recorded spending from the General Fund in OSPI's F-196 financial summary. It excludes separate capital and debt-service funds. Version F-196 2024-25 summary.
OSPI financial-summary enrollment
The enrollment measure in OSPI's ten-year financial summary. It mixes full-time equivalent enrollment for regular K-12 and other programs with birth-to-five special-education headcounts, and includes skill-center summer programs, detention centers and other state institutions. It is not a count of individual K-12 students. Version F-196 2024-25 summary.
Spending per enrollment unit
General Fund expenditures divided by OSPI financial-summary enrollment in the same school year. Version 2026-09 edition.
Selected federal relief programs
OSPI programs 11, 12, 13, 14, 19 and 23: SLFRF enrollment stabilization, ESSER II, ESSER III, ESSER III learning loss, other CARES Act spending and ARP-IDEA special education. The selection deliberately includes program 23, which OSPI groups under special education rather than in its five-code CARES grouping. Version 2026-09 edition.
CPI-U
The U.S. Bureau of Labor Statistics consumer price index for all urban consumers, all items, not seasonally adjusted. Two series are used: the U.S. city average and the Seattle-Tacoma-Bellevue area. Version 2026-09 retrieval.
Inflation window
Each school year's index is the mean of its September-to-August monthly observations. The U.S. series supplies twelve observations per year; the Seattle-area series publishes every second month and supplies six. Version 2026-09 edition.
Change after inflation
The ratio of spending per enrollment unit between the two years, divided by the ratio of the two index means, expressed as a percentage change. Version 2026-09 edition.
Program
An OSPI F-196 program code and its title, used to group expenditures within the General Fund. Version F-196 2024-25 codes.
Updates
Republished edition · September 12, 2026
September 12 clarified that the denominator is OSPI’s financial-summary enrollment, which differs from a student headcount. It also added reporting-entity counts and source definitions. The numerical findings did not change.
Penner Strategy. Washington school spending rose 12.5 percent per enrollment unit, or 0.8 percent after U.S. consumer-price inflation. Version 0002. September 12, 2026. https://pennerstrategy.com/research/washington-school-spending/editions/0002/. Qualification: The denominator is OSPI financial-summary enrollment, which mixes full-time-equivalent K-12 enrollment with birth-to-five special-education headcounts and various institutional programs, so it is not a count of individual K-12 students.